Unity Visualization Toolkit Introduction
The Unity Visualization Toolkit is a collection of tools for performing 3D visualization in a Unity scene.
It includes data structures for structured (gridded) data, unstructured (point) data, and molecular data, as well as a number of visualization objects that can be linked to the data structures to produce isocontour, threshold, volumetric, glyph, and quiver plots.
For this first introduction, we will start with loading a CSV (comma separated value) file into a UVT scene, and creating a glyphset based on the values loaded.
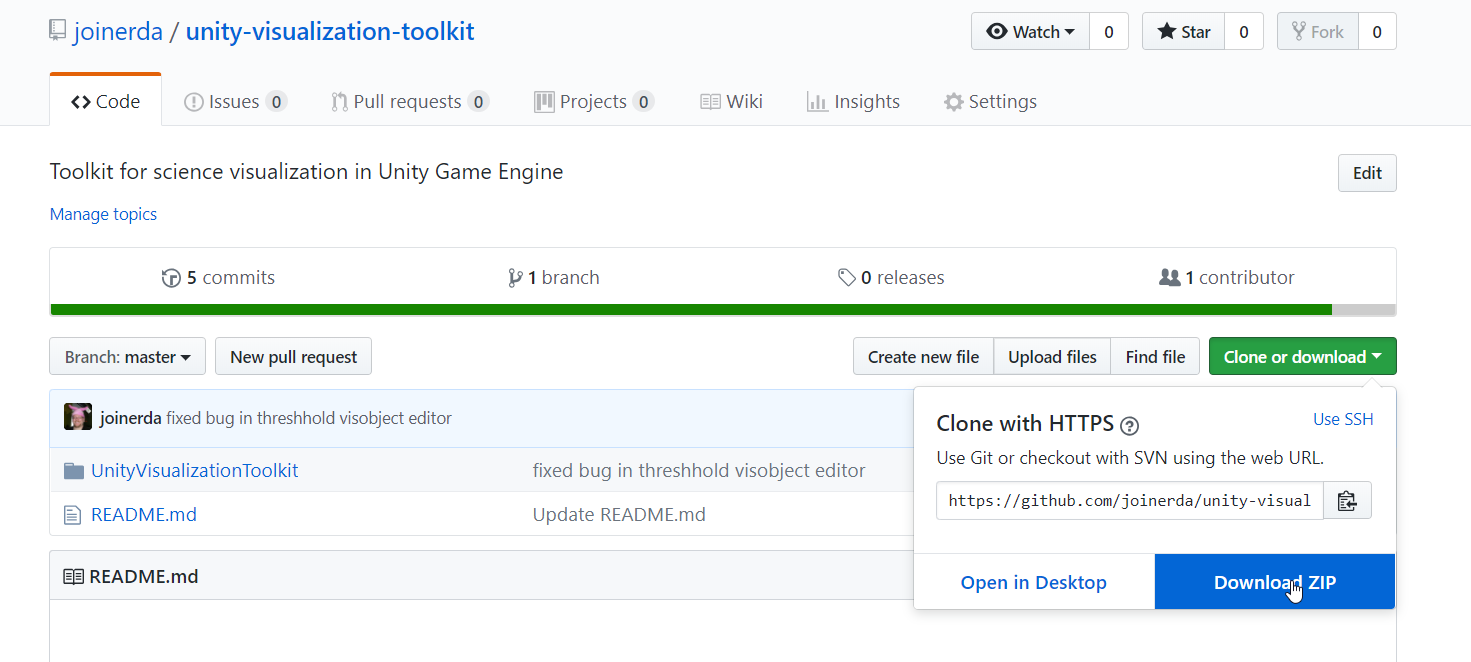
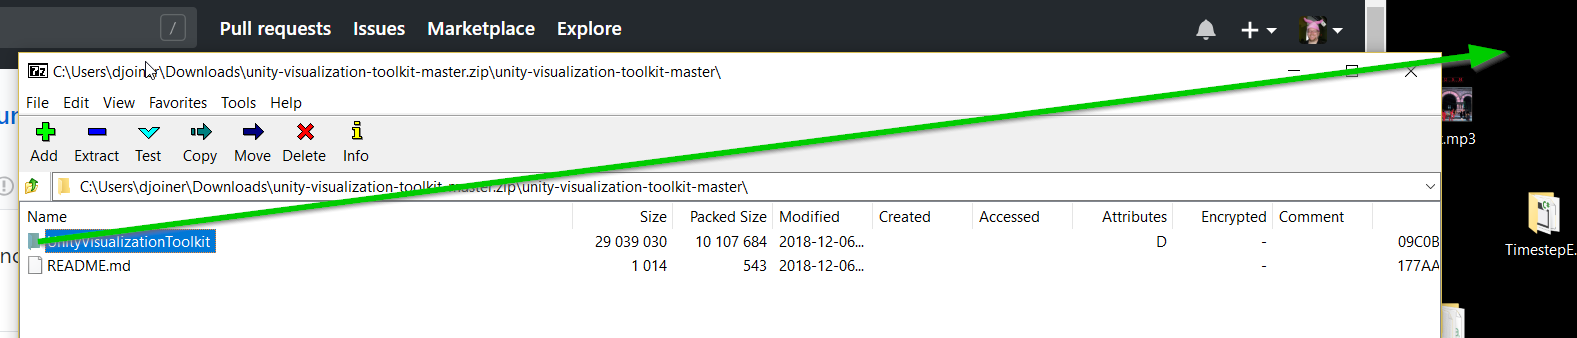
Let’s download the UVT sample project, which includes the UVT library. Uncompress it and move the UnityVisualizationToolkit folder somewhere easily accessible (Desktop, Documents, etc.) Open up Unity and open the UnityVisualizationToolkit project.
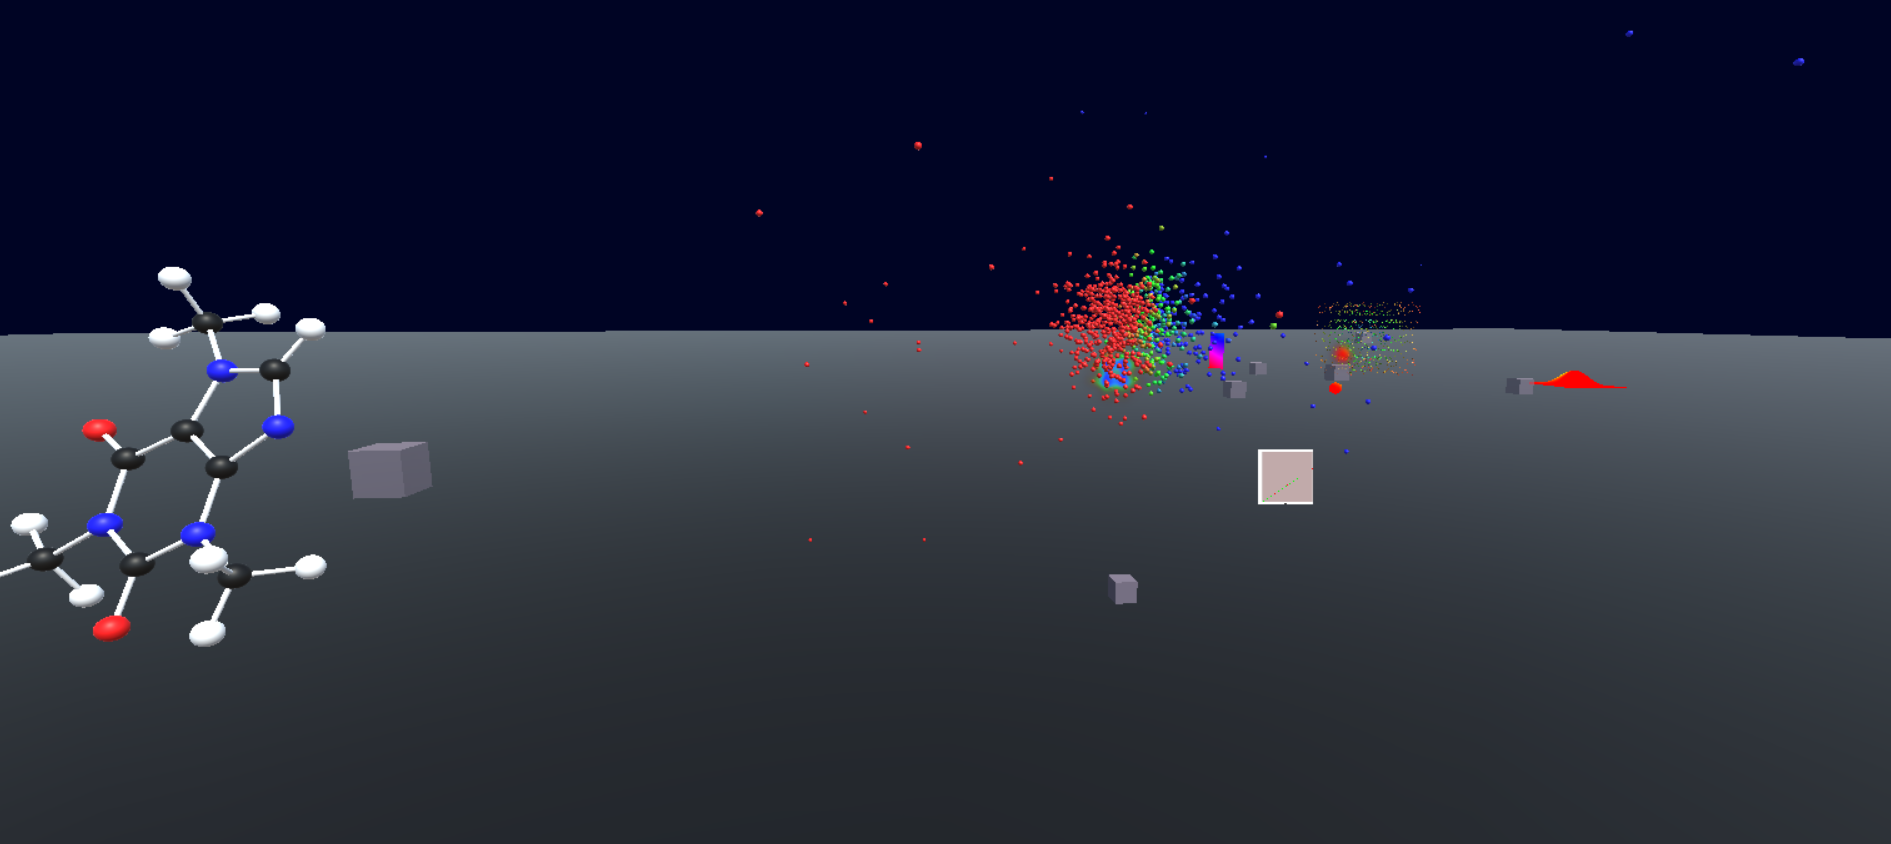
If you want to see some of the visualization types currently supported by the UVT, open the UVT folder in Assets, and open the Scenes folder. Select the Examples scene and press play. You should see a variety of different objects in the scene of different visualization type.
Also notice in Assets there is a folder “BasicPlayer” which includes a flying camera rig similar to the one we created in the simple flying rig post.
Go to the file menu, and start a new scene. Disable the Main Camera. From Assets/BasicPlayer, drag a BasicPlayer prefab into the scene. BasicPlayer is equipped with a “pointing rod” for reference, but this can be distracting, so feel free to open up the BasicPlayer object in your hierarchy, find the cylinder used for the pointing rod, and disable it.
Now lets add some data. We need to have some data to visualize, and place it where Unity knows to look for it.
One way we can enter data into the UVT is to use unstructured data in CSV format. (UVT isn’t picky about delimiters, so either commas or whitespace are fine.) Consider the following file, which includes column names at the top, and one row of data per line.
x y z a b c d
4.18 -2.90 -4.54 46.4 7.02e-21 -0.860 4.44
4.39 3.92 -4.77 57.4 1.14e-25 -0.948 -4.84
0.0221 -0.948 -4.98 25.7 6.68e-12 0.0221 2.40
1.18 -3.60 -0.752 14.9 3.23e-07 0.926 -1.62
-1.07 -2.13 -1.32 7.41 0.000602 -0.875 2.21
-0.000605 -3.44 -3.22 22.2 2.33e-10 -0.000605 -0.733
-4.39 -0.966 -0.976 21.2 6.45e-10 0.949 2.90
-1.94 -4.78 -3.00 35.6 3.47e-16 -0.932 1.66
-1.51 0.550 -3.04 11.8 7.16e-06 -0.998 -4.48
-2.69 1.01 2.93 16.9 4.72e-08 -0.435 -0.601
Name this file something you can remember (I’m naming it SimpleData.csv) and copy it to your Unity project. It needs to go in the folder StreamingAssets/LocalFiles. This is where all of our data files will need to go when creating your UVT scenes.
We need an object in our scene to represent our data. In the UVT folder in Assets, there is a folder AbstractObjects. Notice this has a prefab for a DataObect and a VisObject. Drag a DataObject into the scene. Set the filename for your DataObject to the name of your data file. The default type is UNSTRUCTURED_CSV, and you can leave it as that.
Now we need a visual. Drag a VisObject into the scene, and set its DataObject to the DataObject in our scene. Our data file has columns x y z a b c and d. Under the VisOjbect settings, notice we can change the independent variables. Each of these variables (independent, dependent, color, etc.) should match up with one of our column names. The default is x,y,and z, which we can leave as they are.
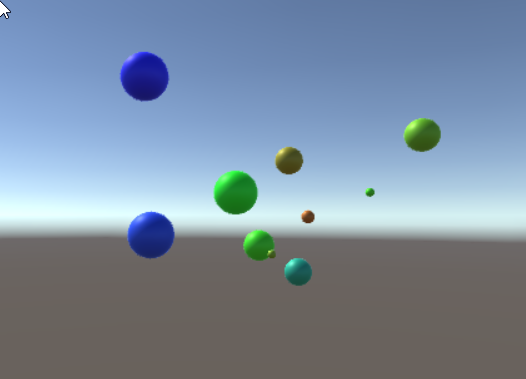
Let’s set the color variable to be “a”. This column of data ranges from 7.41 to 57.4 in the file, so we can use that to set our color scale. I’ll set my color scale to have 3 levels, 0, 25, and 50, and leave the corresponding colors alone (red, green, blue).
For the size variable names, I’ll reset the number of size variables (0 for constant size, 1 for 1D glyphs, and 3 for 3D glyphs) to 1, and use a size variable of b. Playing this, some of my glyphs are a little big relative to the scene, so I’ll adjust the glyph scale to 0.25,0.25,0.25. (Remember any changes you make to your scene while the scene is playing will be undone once you stop playing the scene.)
In the hierarchy panel, I can also enable an axis, currently a child element of the VisObject.
Playing the scene, I’ve still got my “marker” in my scene for my data object (a translucent cube), and if I want to get rid of that I can either move the data object out of the way, or disable the renderer on the object in the inspector.
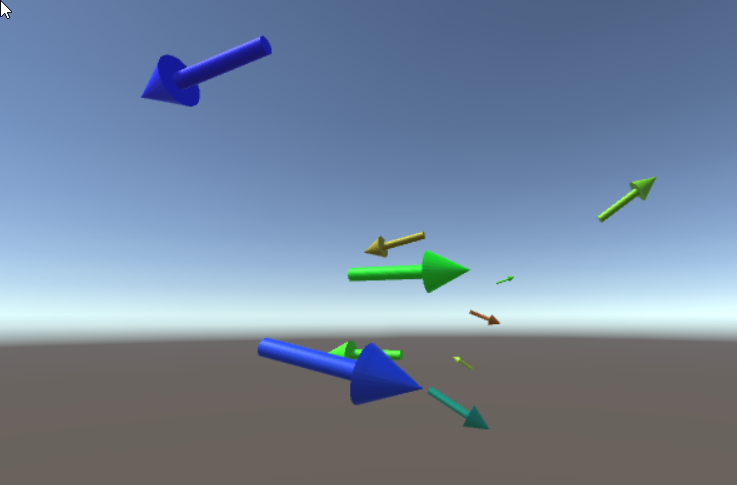
We can make a quiver plot by using 3 size variables instead of 1, and a arrow for our glyph instead of a sphere. Change the number of size variables to three, and use the columns b, c, and d as the x, y, and z components of your 3D glyph. Play your scene and observe how the glyphs are displayed differently.
Using each of the UVT visualization types follows this basic process, and we will cover some of the other visualization types in future posts.